Potential Evapotranspiration from CMIP6 climate projections (NetCDF)#
M. Vremec, December 2022, University of Graz
What is done:
load the data from Copernicus
estimate potential evapotranspiration
plot
Data source:
Copernicus - https://cds.climate.copernicus.eu/ (SSP1-1.9, EC-Earth3 (Europe))
import numpy as np
import pandas as pd
import xarray as xr
import pyet
# Import data
xr_ds = xr.open_dataset("data/example_9/tas_day_EC-Earth3_ssp119_r4i1p1f1_gr_21000601-21000630_v20200425.nc",
            engine="netcdf4")
# Define mean temperature and latitude
tmean = xr_ds["tas"] - 273
lat = xr_ds.lat * np.pi/180
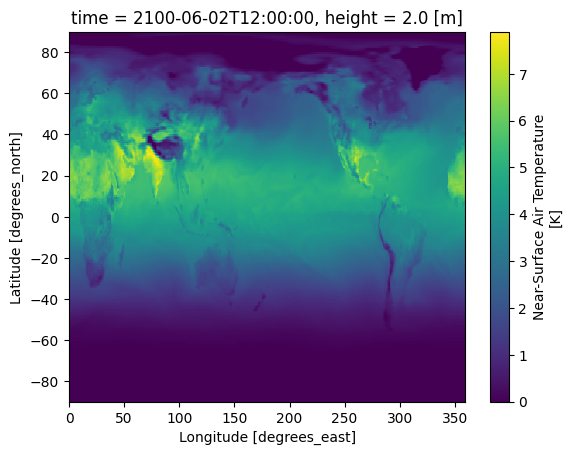
# Compute PET with Oudin
pet_oudin = pyet.oudin(tmean, lat=lat)
pet_oudin.sel(time="2100-6-2").plot()
<matplotlib.collections.QuadMesh at 0x7982220c9150>
Acknowledgement#
We acknowledge the World Climate Research Programme, which, through its Working Group on Coupled Modelling, coordinated and promoted CMIP6. We thank the climate modeling groups for producing and making available their model output, the Earth System Grid Federation (ESGF) for archiving the data and providing access, and the multiple funding agencies who support CMIP6 and ESGF.