Determining the crop coefficient function with Python#
M. Vremec, October 2022, University of Graz
Data source: ZAMG - https://data.hub.zamg.ac.at
What is done:
load the station data from ZAMG
estimate potential evapotranspiration
determine the crop coefficient function based on equation 65 in Allen et al. 1998
plot and store result
import pandas as pd
import matplotlib.pyplot as plt
import numpy as np
import pyet
pyet.show_versions()
Python version: 3.11.14 (main, Apr 27 2026, 17:28:30) [GCC 11.4.0]
Numpy version: 2.4.4
Pandas version: 2.3.3
xarray version: 2026.4.0
Pyet version: 1.5.0
1. Loading daily data from ZAMG (Messstationen Tagesdaten)#
station: Graz Universität 16412
Selected variables:
globalstrahlung (global radiation), J/cm2 needs to be in MJ/m3d, ZAMG abbreviation - strahl
arithmetische windgeschwindigkeit (wind speed), m/s, ZAMG abbreviation - vv
relative feuchte (relative humidity), %, ZAMG abbreviation - rel
lufttemparatur (air temperature) in 2 m, C, ZAMG abbreviation - t
lufttemperatur (air temperature) max in 2 m, C, ZAMG abbreviation - tmax
lufttemperatur (air temperature) min in 2 m, C, ZAMG abbreviation - tmin
latitute and elevation of a station
#read data
data_16412 = pd.read_csv('data/example_1/klima_daily.csv', index_col=1, parse_dates=True)
data_16412
| station | strahl | rel | t | tmax | tmin | vv | |
|---|---|---|---|---|---|---|---|
| time | |||||||
| 2000-01-01 | 16412 | 300.0 | 80.0 | -2.7 | 0.5 | -5.8 | 1.0 |
| 2000-01-02 | 16412 | 250.0 | 86.0 | 0.2 | 2.5 | -2.1 | 1.0 |
| 2000-01-03 | 16412 | 598.0 | 86.0 | 0.6 | 3.6 | -2.4 | 1.0 |
| 2000-01-04 | 16412 | 619.0 | 83.0 | -0.5 | 4.5 | -5.5 | 1.0 |
| 2000-01-05 | 16412 | 463.0 | 84.0 | -0.1 | 5.4 | -5.5 | 1.0 |
| ... | ... | ... | ... | ... | ... | ... | ... |
| 2021-11-07 | 16412 | 852.0 | 74.0 | 8.5 | 12.2 | 4.7 | 1.6 |
| 2021-11-08 | 16412 | 553.0 | 78.0 | 7.5 | 10.4 | 4.5 | 1.6 |
| 2021-11-09 | 16412 | 902.0 | 67.0 | 7.1 | 11.7 | 2.4 | 2.7 |
| 2021-11-10 | 16412 | 785.0 | 79.0 | 5.3 | 10.1 | 0.4 | 2.1 |
| 2021-11-11 | 16412 | 194.0 | 91.0 | 5.1 | 6.5 | 3.7 | 1.1 |
7986 rows × 7 columns
2. Calculate PET for Graz Universität - 16412#
# Convert Glabalstrahlung J/cm2 to MJ/m2 by dividing to 100

meteo = pd.DataFrame({"time":data_16412.index, "tmean":data_16412.t, "tmax":data_16412.tmax, "tmin":data_16412.tmin, "rh":data_16412.rel,
                      "wind":data_16412.vv, "rs":data_16412.strahl/100})
time, tmean, tmax, tmin, rh, wind, rs = [meteo[col] for col in meteo.columns]

lat = 47.077778*np.pi/180  # Latitude of the meteorological station, converting from degrees to radians
elevation = 367  # meters above sea-level

# Estimate potential ET with Penman-Monteith FAO-56
pet_pm = pyet.pm_fao56(tmean, wind, rs=rs, elevation=elevation,
                      lat=lat, tmax=tmax, tmin=tmin, rh=rh)
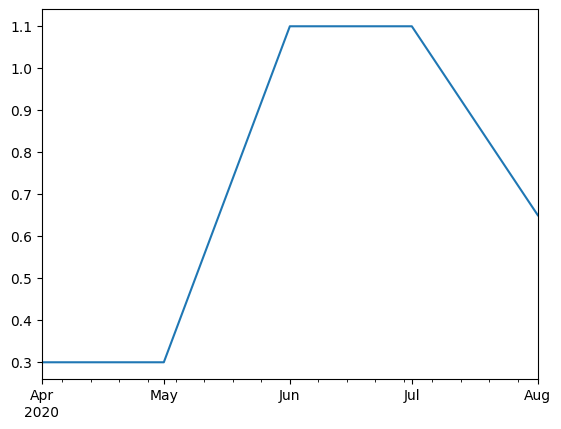
3. Determine the crop coefficient function#
Based on: https://www.fao.org/3/x0490e/x0490e0b.htm figure 34.

Kcini = 0.3
Kcmid = 1.1
Kcend = 0.65

crop_ini = pd.Timestamp("2020-04-01")
crop_dev = pd.Timestamp("2020-05-01")
mid_season = pd.Timestamp("2020-06-01")
late_s_start = pd.Timestamp("2020-07-01")
late_s_end = pd.Timestamp("2020-08-01")
kc = pd.Series(index=[crop_ini, crop_dev, mid_season, late_s_start, late_s_end],
                 data=[Kcini, Kcini, Kcmid, Kcmid, Kcend])
kc = kc.resample("d").mean().interpolate()
kc.plot()
<Axes: >
petc = pet_pm.loc[crop_dev:late_s_end] * kc
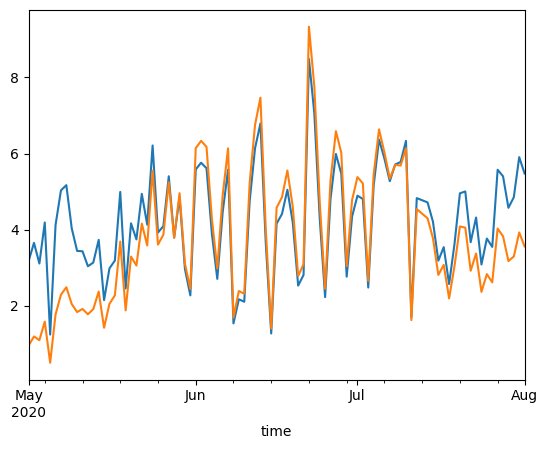
4. Plot results#
pet_pm.loc[crop_dev:late_s_end].plot(label="Potential evapotranspiration")
petc.loc[crop_dev:late_s_end].plot(label="Potential crop evapotranspiration")
<Axes: xlabel='time'>